Between 2013 and 2015 we led a ZTF/LSST precursor experiment with a small team at the Center for Mathematical Modelling and the Millennium Institute of Astrophysics. In the High cadence Transient Survey (HiTS) we looked for supernova explosions in real-time using the Dark Energy Camera. We optimized the survey (see this video) to find the elusive supernova shock breakout in red supergiant stars, designing and implementing all the image processing tools from scratch in the National Laboratory for High Performance Computing, our own real/bogus machine learning classification tools, and visualization tools to aid the discoveries during the observation campaign of about one week in early 2013, 2014 and 2015.
This experiment led us to form an interdisciplinary group focused on astroinformatics. It also made us realize the importance of processing large alert streams such as those produced by ZTF and LSST, leading to the creation of the ALeRCE broker.
The main scientific results from HiTS were the following:
- A deep (24th mag), large field of view (320 deg2 in total), high cadence (2/1.6 hr) optical survey (Förster et al. 2016, ApJ).. See Figure 1.
- 1st real-time survey using DECam data, leading to 125 candidate SNe (Förster et al. 2016, ApJ). See Figure 2.
- Evidence for the absence of red supergiant "envelope" shock breakouts (Förster et al. 2016, ApJ). See Figure 3.
- 1st deep learning real/bogus classifier (Cabrera-Vives et al. 2016, IEEE IJCNN, Cabrera-Vives et al. 2017, ApJ; Reyes et al. 2018, IEEE WCCI). See Figure 4.
- 18 distant RR Lyrae stars used to understand our galaxy's halo (Medina et al. 2017, 2018, ApJ). See Figure 5.
- Thousands of new asteroids discovered (Peña et al. 2018, 2020, AJ). See Figure 6.
- A machine learning classified catalog of variable sources (Martínez-Palomera et al. 2018, AJ). See Figure 7.
- Discovery that most SNe II undergo a phase of confined circumstellar material shock breakout (Förster et al. 2018, Nat. Ast.). See Figure 8.
- 1st combination of hydrodynamical model grids with Markov Chain Monte Carlo inference methods for supernova studies (Förster et al. 2018, Nat. Ast.). See Figure 9.
- 1st recurrent convolutional neural network for the classification of image stamp time series (Carrasco-Davis et al. 2019, PASP). See Figure 10.
- Discovery of new population of intermediate mass black hole candidates (Martínez-Palomera et al. 2020, ApJ). See Figure 11.
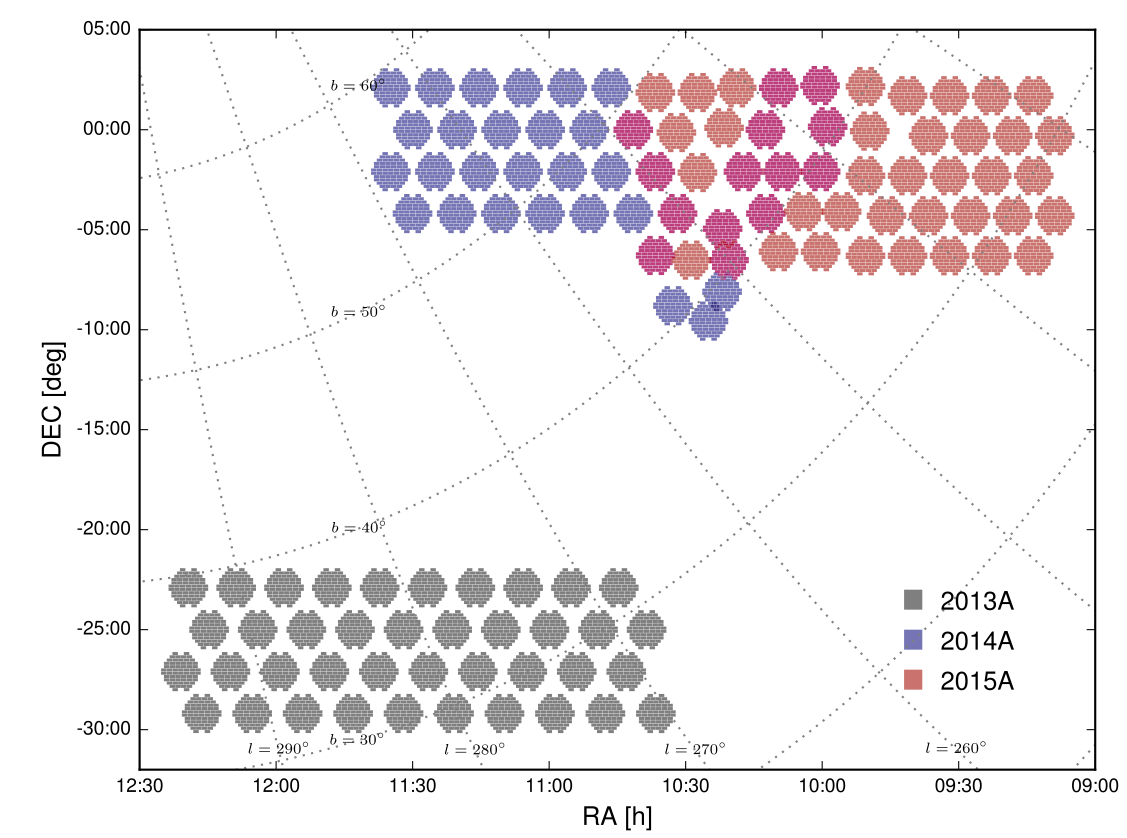
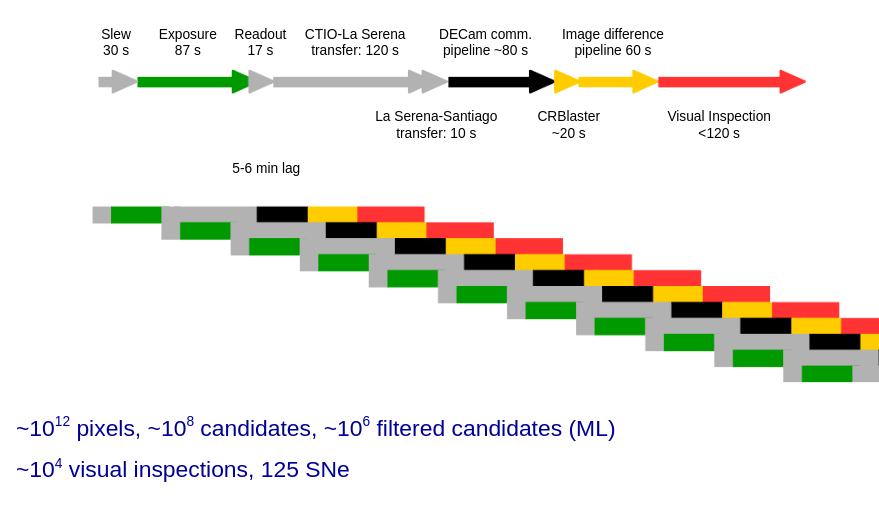
Figure 2: the HiTS image processing pipeline used in the 2015A campaign. The time from ingestion to inspection was of only a few minutes (Förster et al. 2016, ApJ)
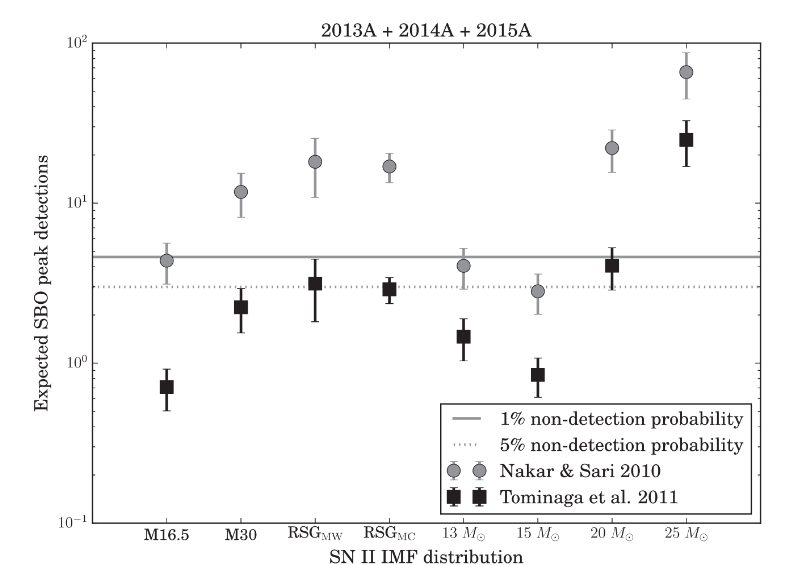
Figure 3: constraints on the presence of red supergiant envelope shock breakouts assuming different progenitor IMFs for the progenitors of this type of explosions (Förster et al. 2016, ApJ).
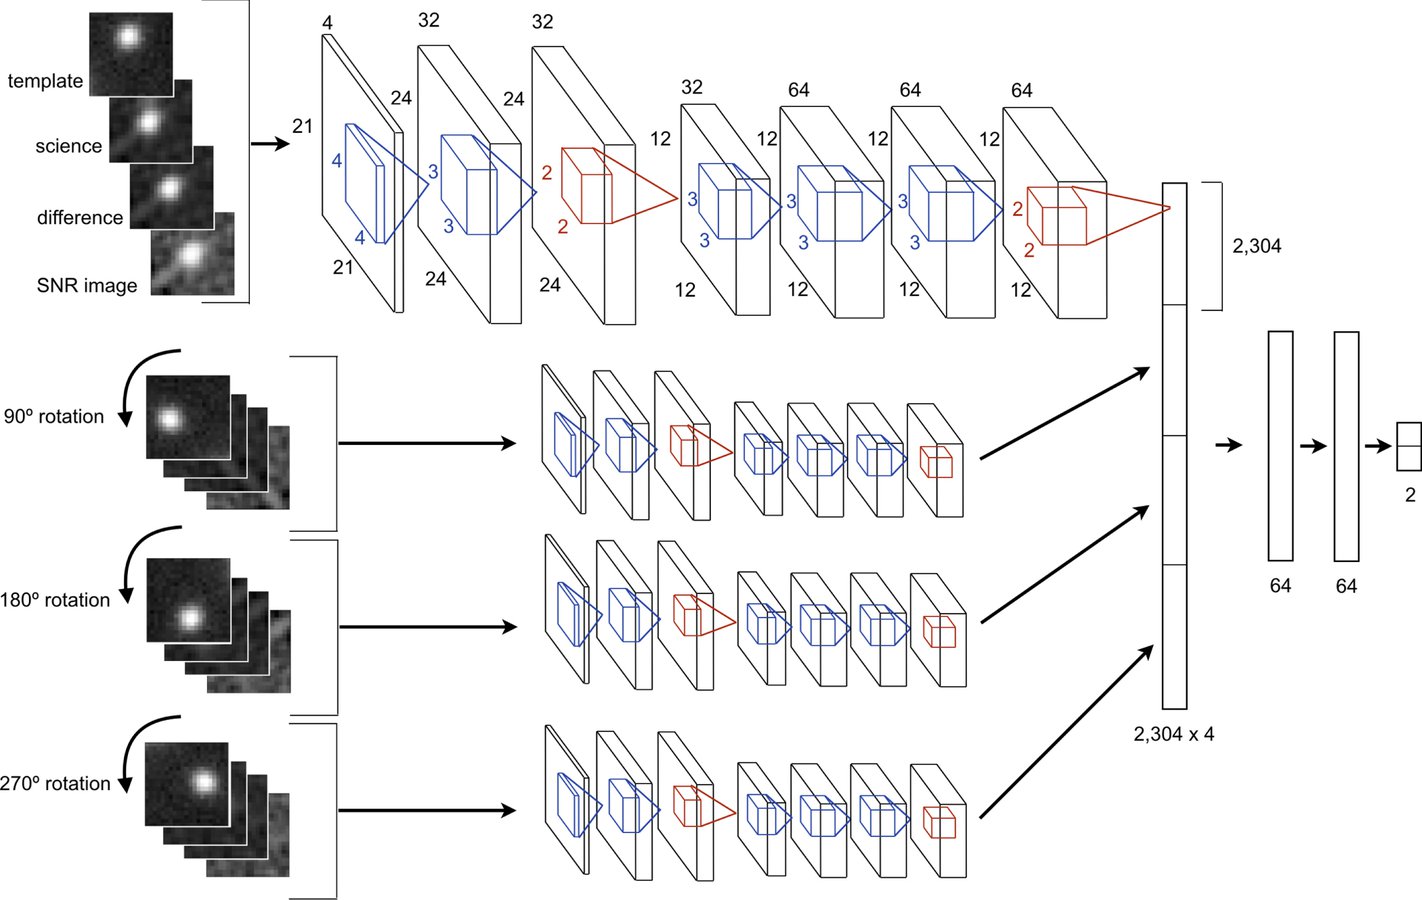
Figure 4: the convolutional neural network architecture used to classify real and bogus candidates (Cabrera-Vives et al. 2017, ApJ).
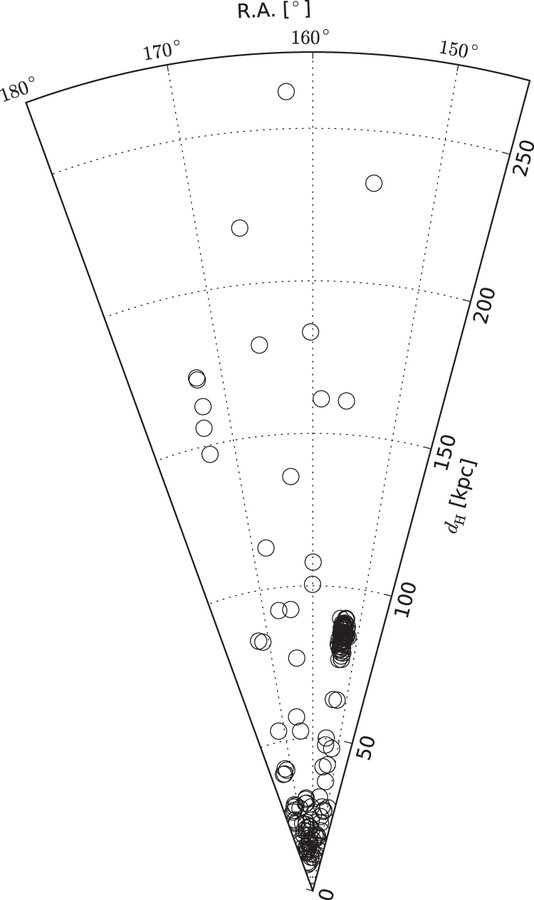
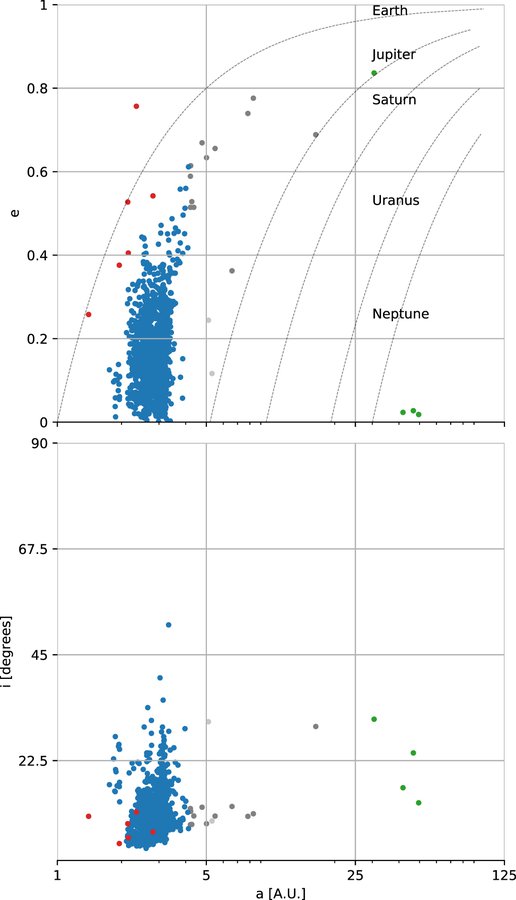
Figure 6: Orbital solution for all tracks detected in at least two nights that yield bound orbits and a maximum deviation of 2″ from the model. The lines show the solutions that share their pericenter distance with the outer planets. Near Earth Objects are shown in red, Main Belt asteroids in blue, Trans-Neptunian objects in green, and others in gray. No Centaurs were found. From Peña et al. 2020, AJ.
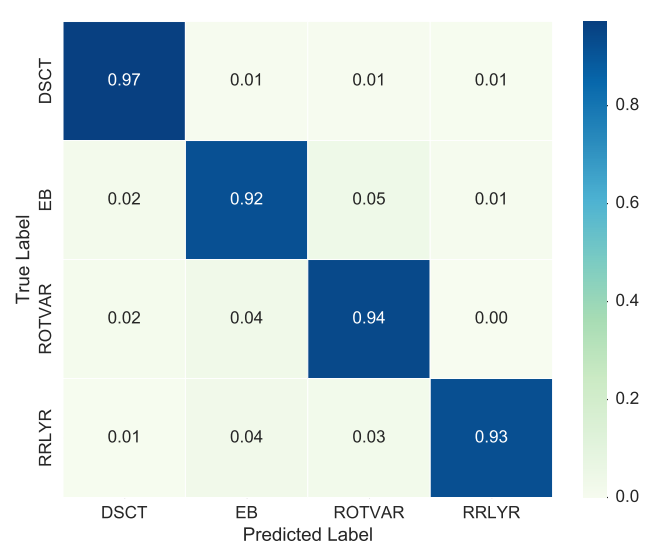
Figure 7: confusion matrix for the periodic sub-classes of the HiTS catalog of variable stars (Martínez-Palomera et al. 2018, AJ).
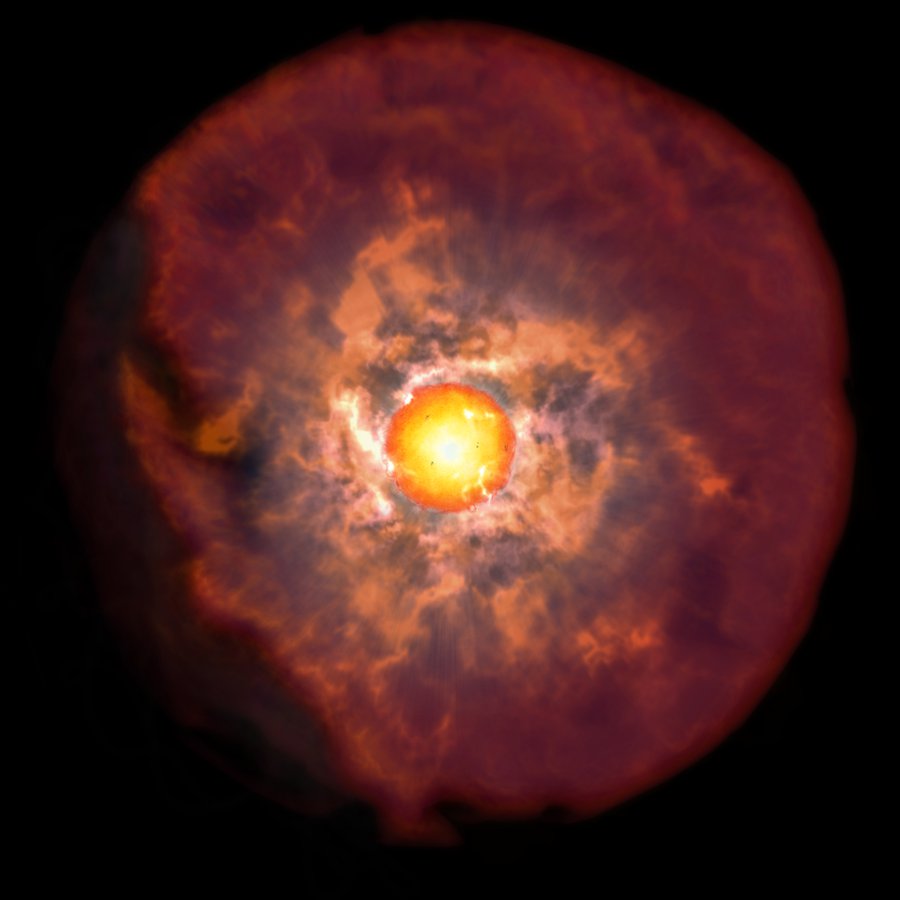
Figure 8: we found evidence for the ubiquitous presence of confined circumstellar material surrounding red supergiant explosions in type II supernova (Förster et al. 2018, Nat. Ast.).
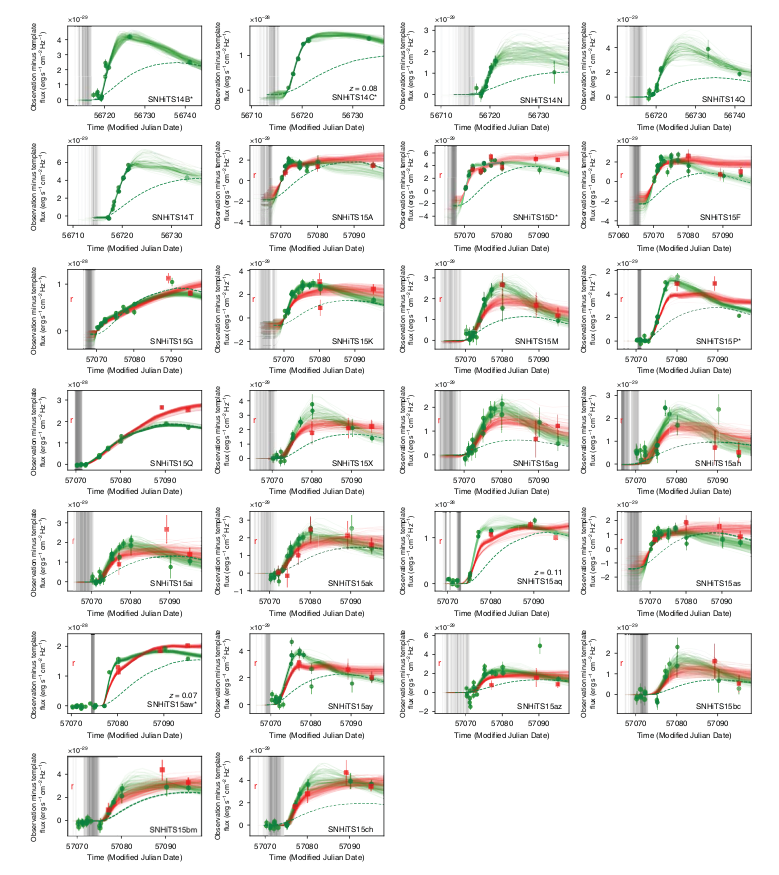
Figure 9: synthetic light curves sampled from the posterior distribution of physical parameters compared to observations of young SN II candidates discovered by the HiTS survey. Dashed lines correspond to models without confined circumstellar material (Förster et al. 2018, Nat. Ast.).
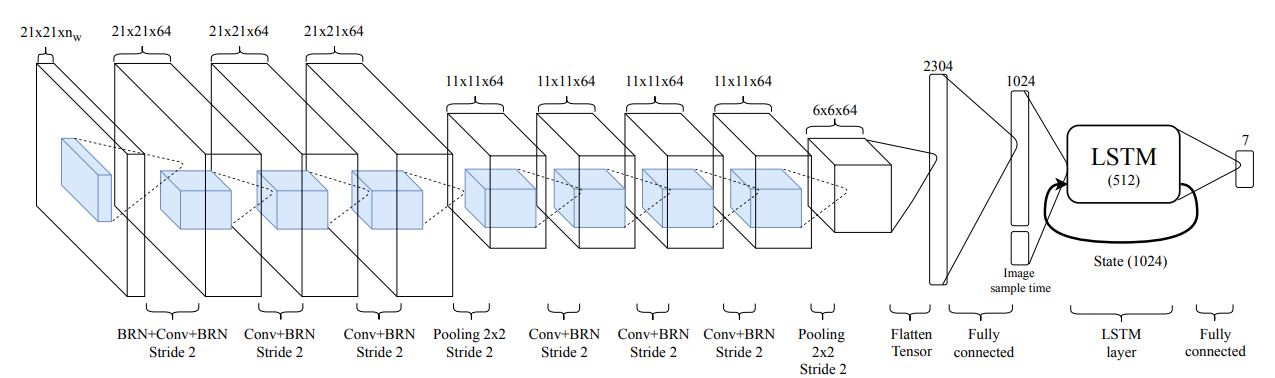
Figure 10: recurrent convolutional neural network architecture used for the classification of time series of image stamps (Carrasco-Davis et al. 2019, PASP).
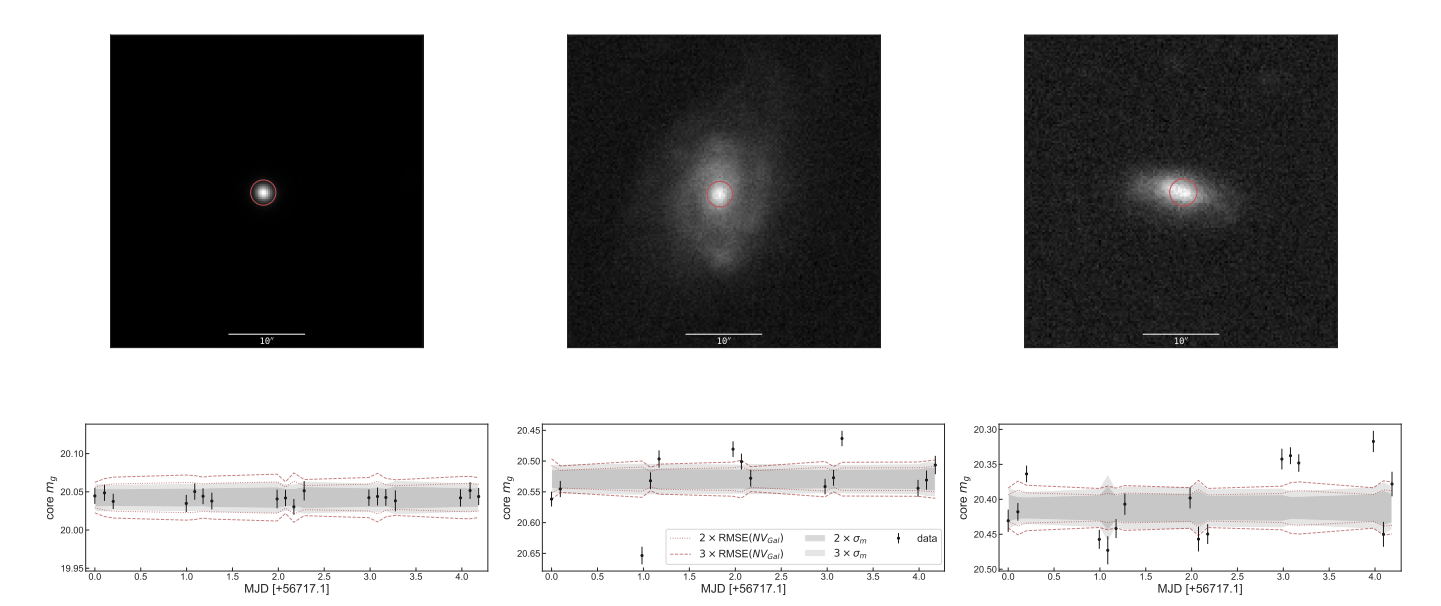
Figure 11: example light curves from the HiTS survey. On the left panel we show a non-variable star, and the middle and right panel show intermediate mass black hole candidate AGNs (Martínez-Palomera et al. 2020, ApJ).